Single phase Inverter synchronization to mains using the zero crossing method and proportional / derivative control with analog components.
This is an introduction on inverter phase synchronization. The simulation files are included at the end of this post.
There are several digital and analog control methods to meet this goal.
In no particular order, we have DFT, KF, WLSE, ANF, KALMAN, PLL,FLL and ZCD. Most of them are documented in the digital (z-domain). A few only are easily implemented in analog.
We will discuss the easiest method, which is the zero crossing detection method, (ZCD) and assume that the inverter is not grid tied, simply synchronized.
Grid tie operation designs are diverse and fall into the grid following, grid forming, or grid supporting designs. This design is not intended for grid tie operation. These designs will be the object of another post.
The application goal, here, is mostly to have the inverter supply a voltage that is synchronized with the mains phase to enable seamless switching with an ATS that is external to the UPS, or inside the UPS unit independent of the technology used (offline,line-interactive or double conversion)
We will provide a hybrid analog/digital LTSpice model for phase synchronisation using the ZCD method.
It is “hybrid” in the sense that the inverter reference sine used in the modulation is phase modulated through a behavioural voltage source, that is more or less equal to what a DDS IC would do, but in a ideal manner since it comes without any quantization noise in LTSpice.
This model will be further updated. Note that phase synchronization using the ZCD method is performed using fully digital means in commercial ASICs. Providing a partially analog method is useful however for teaching analog control and for certain niche cases where the inverter SPWM generation and control feedback cannot be fully automated in the digital domain. (like using an Arduino instead of a fully capable DDS platform), In these cases, offloading part of the control loop to analog components is an option. Generally, fully analog control is less and less used except for simple feedback like in SMPS.
But there are still niche uses, for instance, an environment subject to ionizing radiation where hardening the ASIC is not possible, would be more robust in analog but that would require a fully analog control loop.
How to get phase difference between mains phase and inverter phase using ZCD the analog way ?
The analog ZCD method translates a sine wave (here, the output of the inverter or that of the mains power) into a square wave signal. the rising edge of the square wave signal happens at the upward zero crossing of the phase, and the falling edge at the downward crossing of the phase.
ZC sine to square wave conversion is done both for the mains and inverter phases. This is done using an op-amp comparator without feedback for each phase. The output signal is a square wave with rail to rail voltage levels.
Then, the two square signals are compared using two D type flip-flops, giving outputs pulses widths that are equal to the absolute phase difference information. (it outputs time information, not an angle value)
The method is explained in “Phase measuring circuit with leadlag indication” by Forrest P. Clay Jr. a 1992 electrical engineering paper.
https://sci-hub.ru/10.1119/1.16908
This method preserves the phase lag/lead information. One flip-flop provides HIGH output in leading conditions, While the other provides HIGH output in lagging conditions. Fundamental pulse frequency is the same as the mains and inverter frequency (assuming that both have a frequency deviation that is negligible compared to the nominal frequency) that is, 50 Hz in the model.
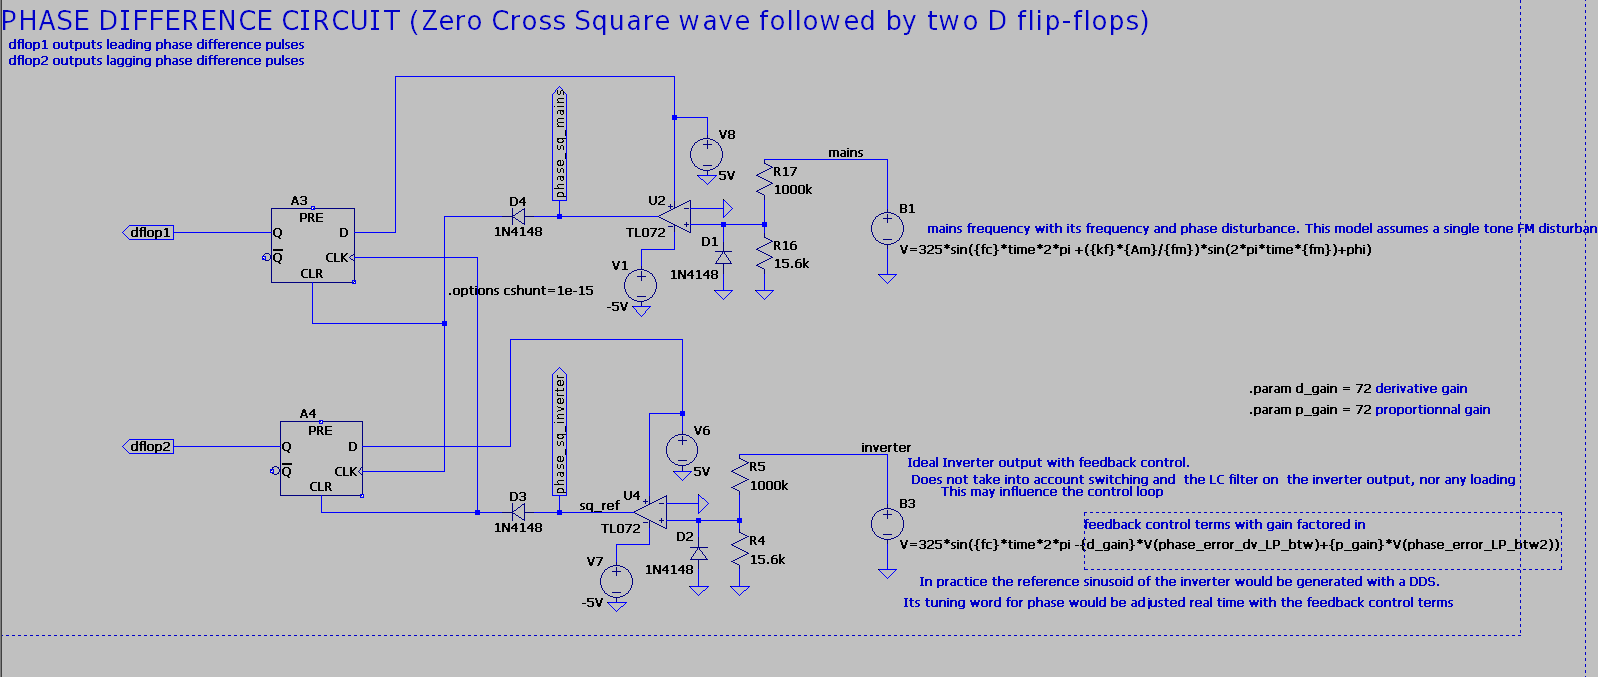
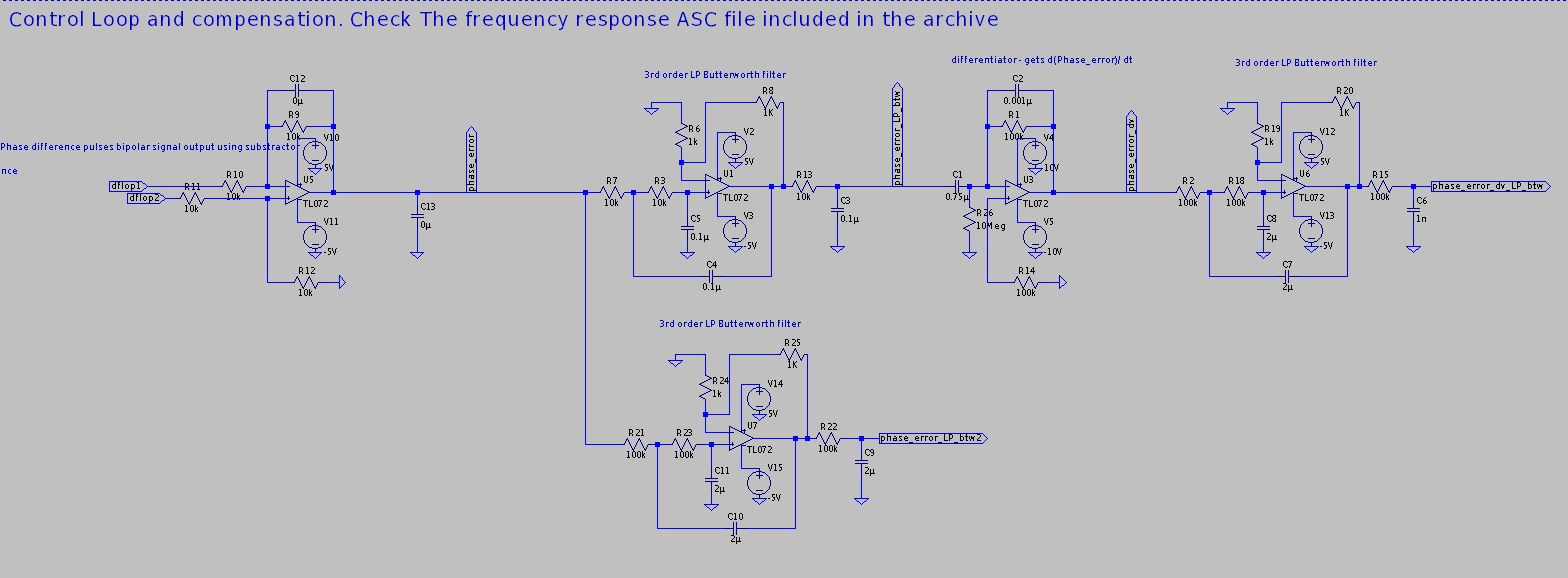
Then, the output from the flip-flops is given to an op-amp substractor that generates a bipolar signal of the phase difference. Positive pulses mean leading while negative pulses mean lagging. Care must be given to the resistors tolerances (1% or better) in a substractor to minimize common mode interference, and a suitable OpAmp for this kind of use is prefered.
This signal is then low pass filtered to remove edge induced discontinuities. Note that usually the mains frequency slew rate is really slow because of the huge rotational inertia of all generators creating the mains distribution network and all regulation mechanisms in place. So it is not a problem to have a filter with a very low cutoff frequency. On the other hand, if the inverter were to synchronize to an islanded generator, that would be a whole different scenario. It is outside the scope of the current article. For these scenarios, other synchronization methods exists, and we named a few at the beginning of the article.
The filter used is an analog 3rd order butterworth LP filter, to get a sharp rolloff. The first stage has a quite high corner frequency, in order to minimize filter phase effects at low frequencies. Its goal is to minimize rising and falling edges coming from the ZCD and flip-flops well enough for the differentiator stage not to complain.
We then get a smoothed phase shift signal $$ \Delta \varphi $$ . This is fed to a differentiator op-amp setup. Its role is to generate the $$ \frac{d(\Delta \varphi )}{dt} $$ signal used further in the control loop. Note that because of processing this signal has a delay, so our notation is a little it abusive.
This signal is further processed using a second 3rd order butterworth LP filter, with a corner frequency way lower than the first butterworth filter. This gets rid of the spikes in the signal. The corner frequency is around 1Hz.
This concludes the generation of the $$ \frac{d(\Delta \varphi )}{dt} $$ processed signal that will be fed to the control loop of the inverter, for the derivative term.
In parallel, we need to get the proportional term. This will use a single butterworth 3rd order LP filter that branches just after the substractor. This will generate the proportional term also fed to the control loop of the inverter. This filter has a lower corner frequency compared to the first LP filter stage used for the differentiator branch.
Note that the final butterworth filter of the derivative signal branch has been slightly tuned out from its canonical form to get an appropriate control loop frequency/phase response.
Other than that, the remaining filters are quite the same. The differentiator has an added C2 capacitor to filter high frequency terms and provide less oscillation.
These two signals (proportional and derivative) are then factored with their respective gains (both are the same in the simulation) and fed as a sum to the behavioural voltage source of the inverter using the phase term of its function.
Note that this is a simplified model of the inverter stage. A more realistic but computationally intensive model would control the sinusoidal reference of the SPWM stage of the inverter, and inverter output would be fed to one leg of the phase difference detector. This would integrate the whole SPWM inverter model to this simulation. Note that this simulation do not include RLC loading of any of the phases. Also, this model supposes that the mains and inverter AC voltages are the same and stable at AC RMS = 230V.
One advantage is that the ZCD method is quite tolerant to voltage variations, compared to methods that are sensitive to it like PLL, So It is not critical to have it factored in this simulation.
AC Analysis of the control loop
An open loop AC analysis starting from the input to the first LP butterworth filter up to the output of the sum of the derivative and proportional terms with their respective gains has been performed.
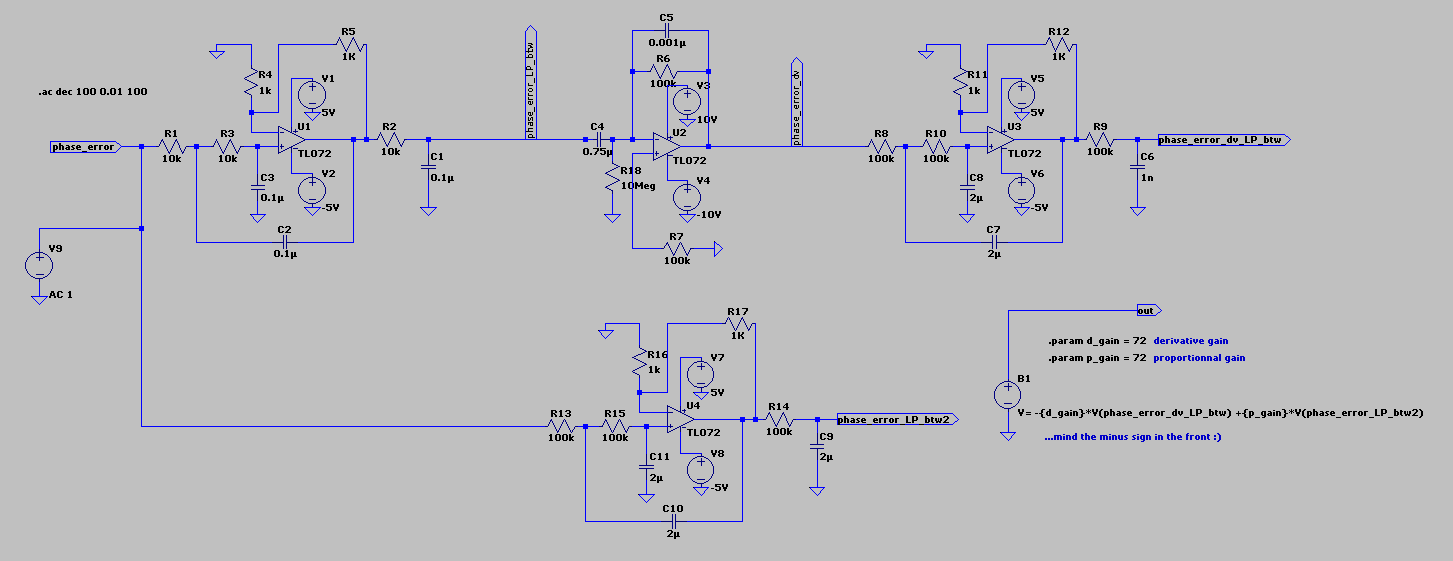
The range of frequency analysis for our first inspection is 0.001 Hz to 100 Hz
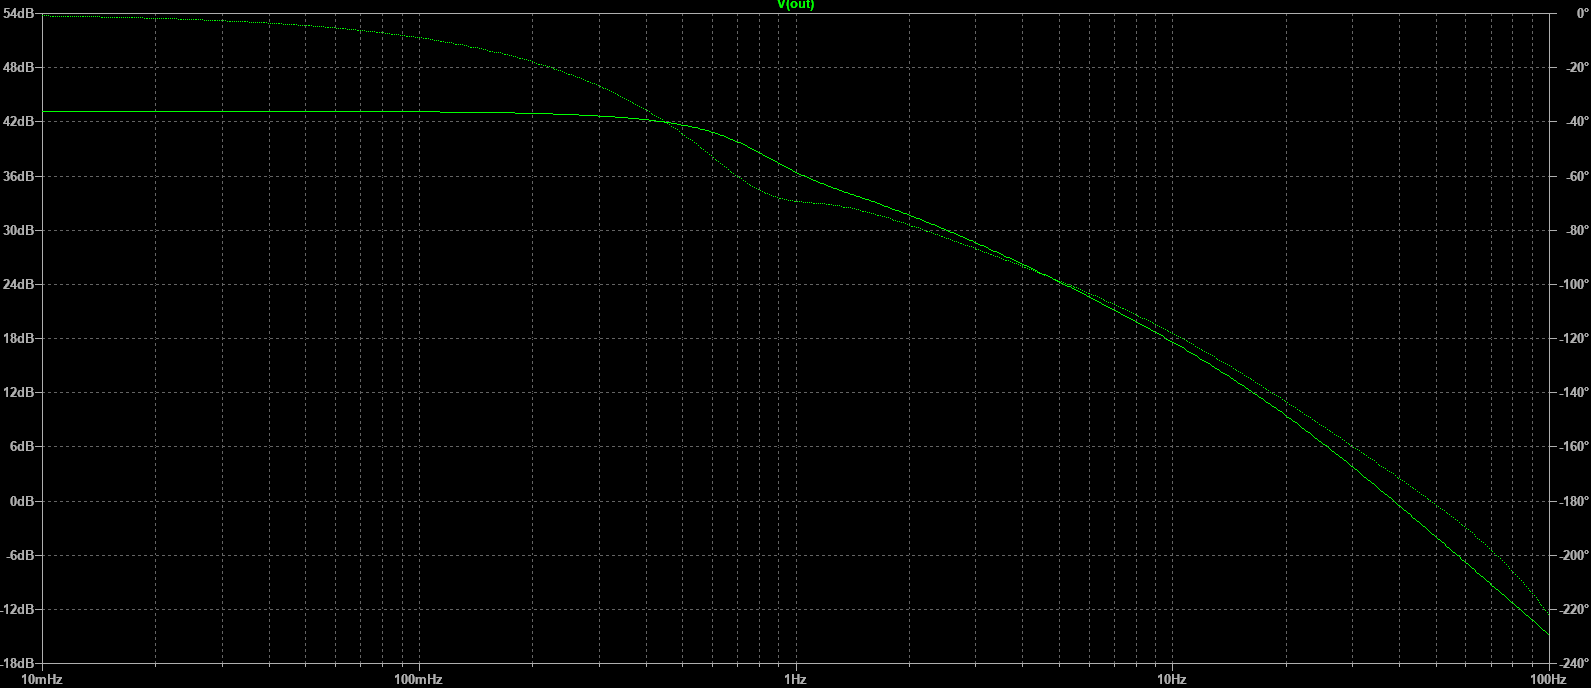
The cutoff frequency is approximately 0.66 Hz
The DC Gain is approximately 43.2 dB with a flat response.
Gain margin is -3.5 dB (at f_GM = 48.1 Hz) This could be improved for stability, knowing that this frequency is quite critical being close to the 50 Hz component in the phase difference pulse signal.
Phase Margin is 9.8° degrees (at f_PM = 38.6 Hz). Phase margin could also be boosted. Phase margin stays positive below f_pm.
There is a pole around 0.66 Hz and another close to 1 Hz, barely visible in the plot.
The control loop will be further optimized when I have time. I am no guru of control loops and filters so if you manage to get an optimized model, please chime in using the contact form…
Mains Disturbance simulation
Frequency disturbance
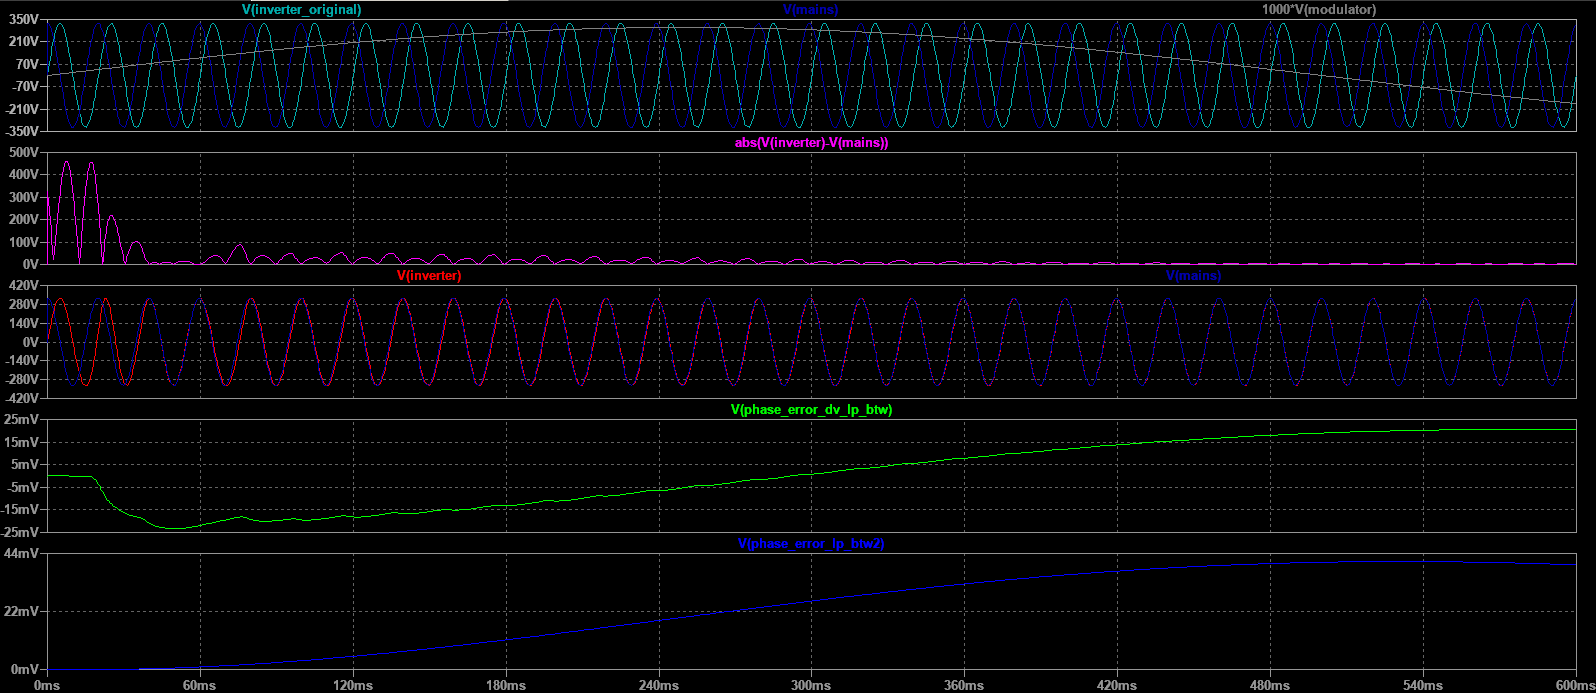
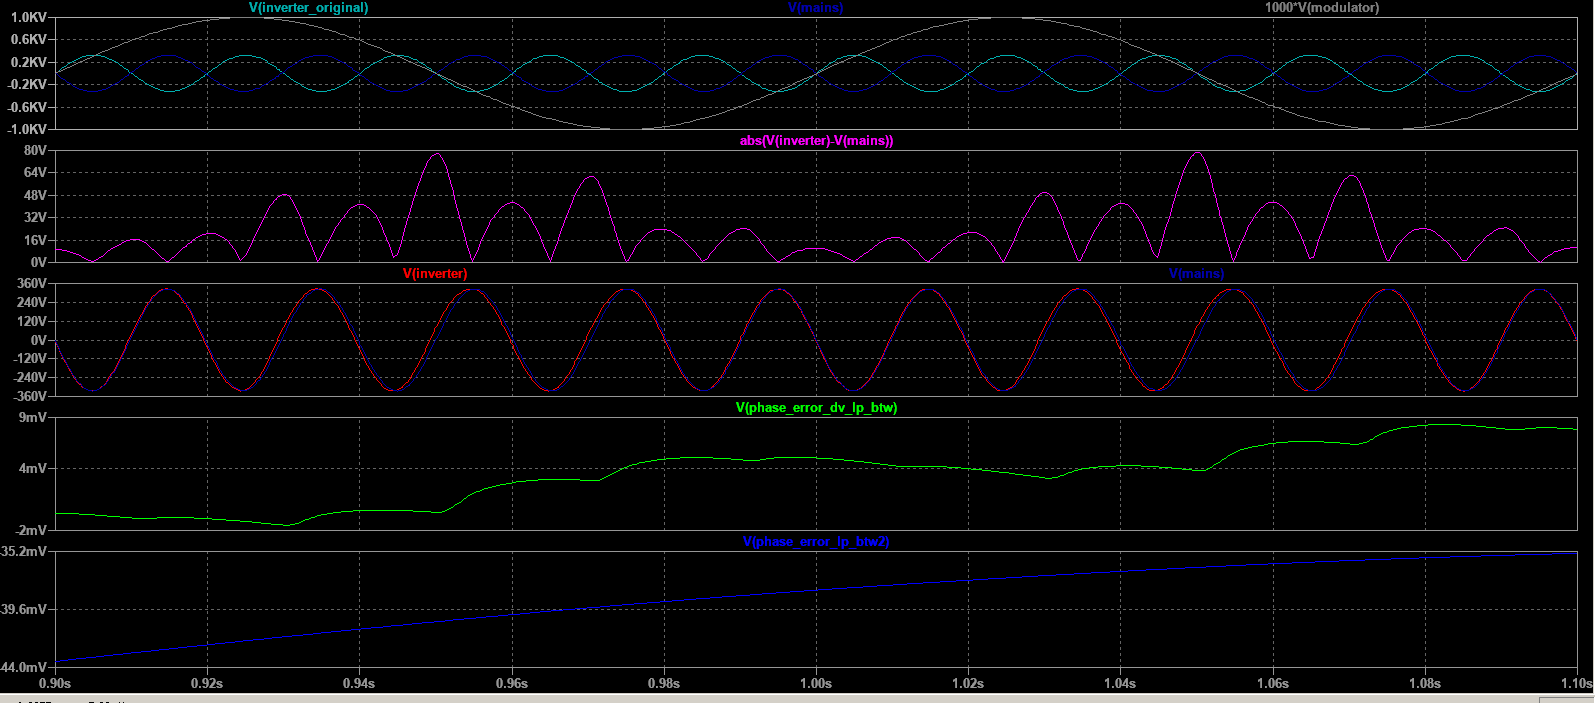
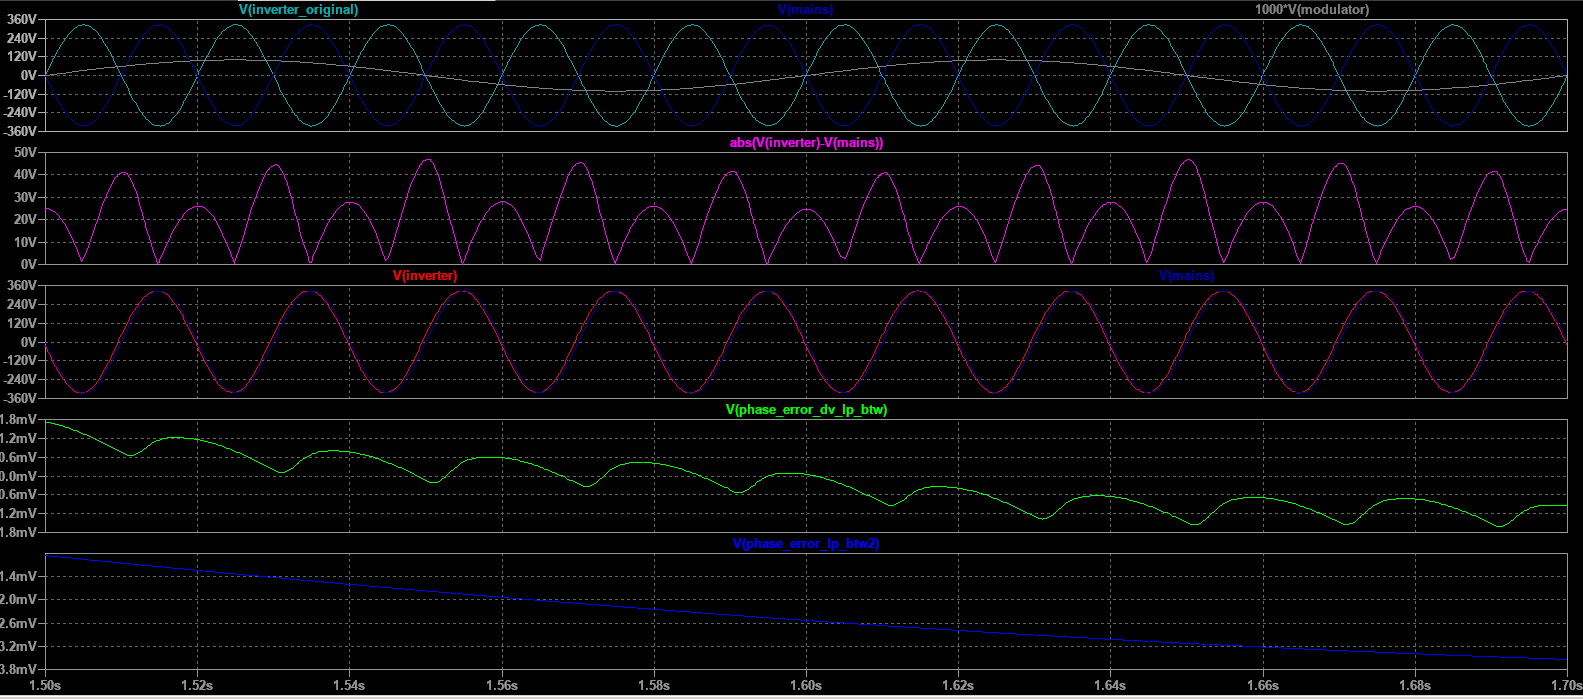
The first goal is to characterize how tightly the inverters locks on the mains frequency that is, $$ min(\Delta \varphi) $$ and $$ max(\Delta \varphi) $$ for a given mains frequency disturbance scenario. We also used a simple function to get an idea of the magnitude of the absolute phase difference by plotting $$ \left | V_{inverter} – V_{mains} \right | $$ and look at the local maxima. note that this plot does not suffer from the delays coming from the LP filters.
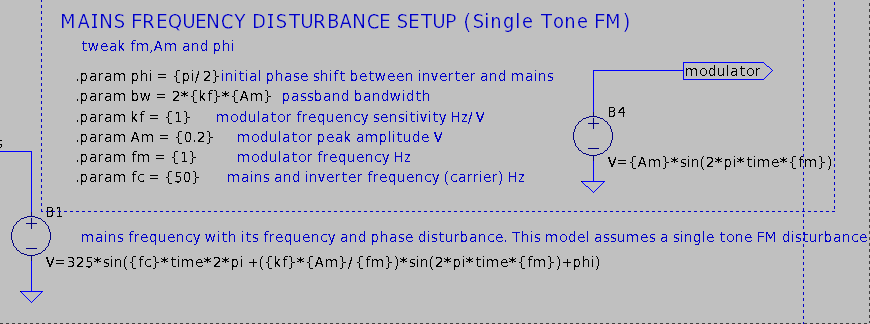
The disturbance scenario modeled this far is a mains frequency oscillation with a parametrized slew rate and oscillation amplitude, using a simple FM modulation scheme. The peak instantaneous frequency deviation will be restricted first to ±0.2 Hz to get in line with the ENTSOE ordinary and contigency frequency deviations, that is, an oscillation between 49.8 and 50.2 Hz
Frequency Stability Evaluation Criteria for the Synchronous Zone of Continental Europe
(section 3, Evaluation Criteria)
There is also this small study from Twente University from 2005 about stability of mains tied clocks.
Accuracy and stability of the 50 Hz mains frequency
https://wwwhome.ewi.utwente.nl/~ptdeboer/misc/mains.html
Since time keeping by these clocks rely on the number of cycles of the mains period, it makes sense to calculate the phase error. This study precisely do this, measuring phase deviations and not only frequency deviations. Phase errors in a power distribution grid come from frequency instability. To compensate for phase errors, an utility company would have to precisely manage frequency compensation at regular intervals to “get back” to the theoretical number of cycles expected. The priority is frequency, not phase, and mains tied clocks are superseded by GPS. However, this anecdotal study is however of special interest since we are dealing with both frequency and phase adjustments in grid synchronization. Note also that an abrupt phase adjustment in a rotational generator such as synchronous machines used in power plants would come from disastrous events such as pole slipping and/or sudden uncompensated load rejection. It should never happen on the scale of an utility grid.
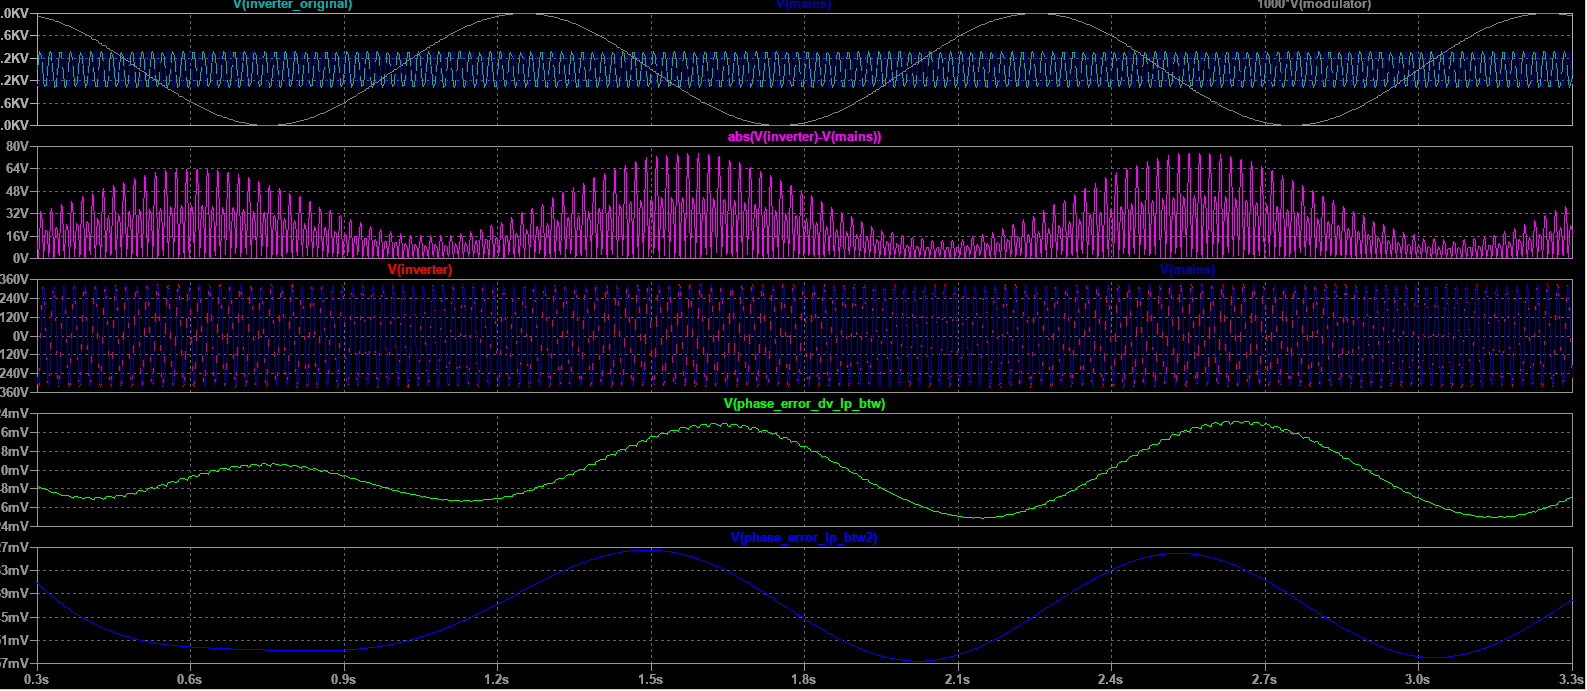
As for the frequency, the slew rate for mains frequency is extremely low in ordinary and even contingency modes, So a rate of 1 Hz is already an extreme worst case scenario. Higher slew rates however happen with islanded generators, but this is outside the goal of this simulation. Given the response of the control loop, low slew rates should not pose a stability problem. However, this depends on the detection threshold of the flip-flop stage. A minimal instantaneous frequency deviation would not be catched until it reaches this threshold.
Note also that frequency deviations include stochastic noise but also predictable deviations according to load consumption and power generation imbalances. Periods of high demand typically introduces a negative frequency deviation until the power generated matches the load power.
As said before, the ZCD method is sensitive to harmonic disturbances typically introduced in non-inverter type islanded generators with low power handling capability relative to load. Thus, further characterizing the control loop for worst case scenarios would need to introduce this kind of disturbance, if one were to use ZCD with generators nonetheless.
Amplitude disturbance
<to_be_continued>
Phase synchronization from arbitrary initial phase difference
The other goal of the simulation is obviously to track the performance of phase locking from an initial arbitrary phase difference. The inverter has to lock its phase at 0° degrees phase difference from any starting phase difference ranging from -180° to +180° degrees. The performance of this locking process, that is how fast the phases converge to 0° and if the inverter experiences excessive harmonic disturbances during this process will have to be characterized.
Assuming both mains and inverter voltages are of the same amplitude, perfectly sinusoidal, and that the inverters track frequency change instantly or that the simulation is performed at fixed AC mains frequency, performance of phase synchronism can be measured through the following formula, giving the the absolute value of voltage phase difference.
$$ (1)\hspace{1cm} \left | \Delta \varphi \right | = 2arcsin(peak( \frac{\left |V_{mains}(t) – V_{inverter}(t)\right |}{2V_{max}} )) $$
Note that for $$ \left | \Delta \varphi \right | \ll \pi $$
$$ (1a)\hspace{1cm} \left | \Delta \varphi \right | \approx peak( \frac{\left |V_{mains}(t) – V_{inverter}(t)\right |}{V_{max}} ) $$
with peak() defined as the function that returns the peak value as a step function over the time range of interest defined below and
$$ (2)\hspace{1cm} V_{max} $$
the mains and inverter voltage amplitude.
$$ (3)\hspace{1cm} \left [ t_{1} , t_{2} \right ] $$
Since the ‘periodicity’ (the periodicity of the mains frequency induced harmonic component) of the function above is $$ \frac{1}{2f_{mains}} $$, that gives the optimal sample time to extract the maxima when sampling the above function (1)
The above function (1) can be simply plotted. If you need to extract maxima at sampled intervals use these LTspice directives and loop them with subsequent time intervals of $$ \frac{1}{2f_{mains}} $$ and put them into a .MEAS file, although it would need a long simulation time to make sense. For complex data analysis it is better to make a LTspice export of the data and process it with Python for instance.
.meas TRAN Vdiff_abs_norm_max MAX (abs((V(vl) -V(vn)) - V(mains))/(2*1.414*{V_ac}) ) FROM 0ms TO 10ms
.meas TRAN delta_phi_abs_max PARAM 2*asin(Vdiff_abs_norm_max)
measuring the minimum phase difference (best performance at steady state) is less trivial because of zeros in the function when the sine waveforms cross each other, therefore it would require sampling the phase difference with the above method and then analyze the resulting data for local minimums. Overall, another useful metric is simply done by averaging the sampled maximum phase difference (CTRL+click) for function (1) over a long interval, preferably equal to a full oscillatory cycle that arises from the control loop, if one is found.
Finally, performance in phase locking has to be demonstrated in conjunction with a FM disturbed mains frequency.
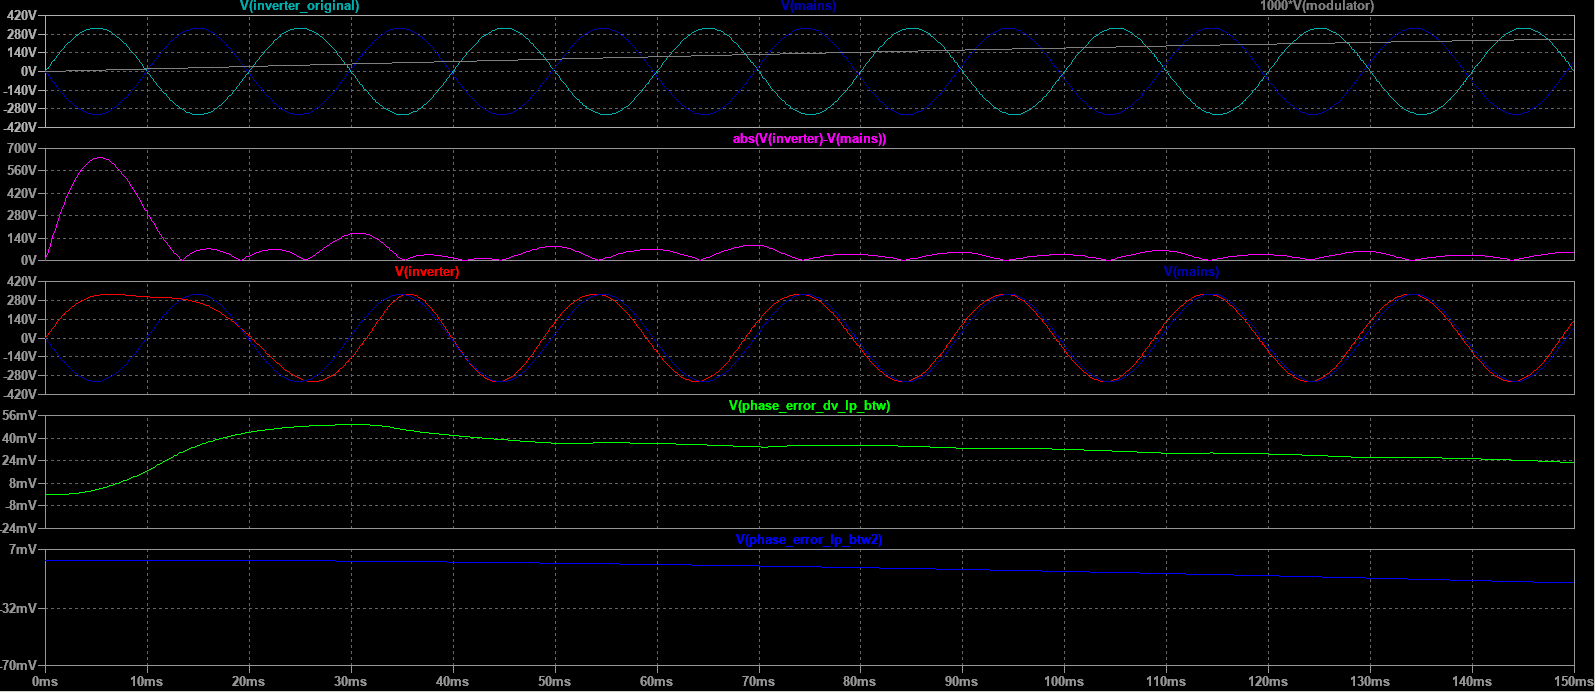
Note that phase locking is preferably done while keeping the waveform sinusoidal in nature during the process. Phase locking in figure 2 happens too quickly, and has the effect of producing severe distortion. The inverter should have adequate protection to not supply power during this event, only after proper phase locking is done. In a mains synchronized double conversion UPS, this could happen if the input is switched between two phases (120°shift) or after the powering on and transfer to a generator. Since a double conversion UPS always provides power through the Inverter stage with no possible downtime except a minimal one for switching to and from bypass mode, the control loop has to be tuned to take that into account. A modification of the phase control term in the sine wave DDS generator could be done and would take effect only during these initialization/switching events, for instance, using
$$ 1-\exp\left(-a\cdot t\right) $$
as a factor of the control term, ‘a’ controlling how fast the control loop locks into the mains phase.
Simulation results
Using the ZCD method, sampling time is limited at two times the mains AC frequency. That limits accuracy of the algorithm for fast and ample disturbances. But a heavily distorted power source would not lead to any application requiring syncing into it, rendering that issue moot.
On the other hand, ZCD is quite tolerant to voltage fluctuations.
Conclusion
Although this controller is simple to implement, it suffers from steady state error due to the limited gain at DC. One option to mitigate this is to add an integral component. However, it would still suffer from delayed response to oscillations due to the butterworth filters, and cannot track fast oscillations. The ZCD+Flip Flop stage also samples phase at 1/2*f_ac, which is a limiting factor. The non linear behaviour introduced by the discrete function of the flip flops, who encode phase difference as a pulse further make the tuning of the control loop harder, with the need to analyze the impulse response of the system. However the discrete ZCD phase difference method is more robust when it comes to voltage imbalance between the two measured phases.
In a next post, we will propose a time continuous control of phase difference without flip-flops in the control loop signal path (although one is still needed in the circuit).
To get back to the conclusion on this model : Its performance level is unacceptable for grid tie operations, nor it provides the required functions and behaviour of GFL,GFM,GS grid tie topologies. That is why we limit it to synchronization for inverter standby/autonomous operation to alleviate source switching transients. But it is a good introduction on the subject. For an idea, it is closer to the state of the art for the start of the 90s or so, when digital control was not yet so widespread.
We will discuss grid tie inverters in a later post and slowly but surely move into the more state of the art technologies. It will also serve as an introduction into fully closed loop control systems, as with grid tie inverters, voltage,current quantities are intimately tied, and reactive power effects have to be taken into account.
Beware, the learning curve will be steep.
Leave a Reply